by Sarah Middle
One aspect of the data enhancement that forms part of the Tools of Knowledge project involves connecting the remodelled SIMON database with object data from partner institutions. Bringing in object data, as a first step, allows us to make more connections, undertake new kinds of analysis, and reveal new stories about makers, objects, and the relationships between them. However, these objects do not exist solely in relation to their makers; they have also been involved in fascinating journeys (or itineraries) of their own, which continue even within the institutions that hold them. Modelling these itineraries will allow more object-focused work and enable us to view the makers from different perspectives.
What is an ‘Object Itinerary’?
Cultural heritage objects are not static or inert; instead, each one represents a journey through space and time to reach its current context. This journey consists of a sequence of events, which might include its creation, use, alteration, movement, and acquisition, and may ultimately lead to its decay or destruction. Each of these events occurs in a particular place, at a particular time, and often involves the actions of a person or organisation. As such, these sequences are often referred to as ‘object biographies’, a term introduced by Kopytoff (1986) in a social anthropology context, and since adopted in archaeology (Gosden & Marshall, 1999) and museum studies (Alberti, 2005).
The term ‘object itinerary’ has a similar meaning but implies a more continuous trajectory without the fixed events of birth and death (Fontijn, 2013). An itinerary might therefore look back to the formation of the materials from which the object was constructed or look forward to its future receptions or remediations. Fundamentally, an object itinerary represents a network of relationships between that object and its interactions throughout space and time.
Modelling Object Itineraries
In a previous blog post, we introduced the idea of event-based data modelling, where people, such as the scientific instrument makers in SIMON, can be described in terms of events that occurred throughout their lives; the same approach can be applied to objects. To start to bring these ideas to life, I have developed some initial case studies using objects from Tools of Knowledge partner institutions.
Case Study 1: Shelton Clock
My first case study is on an astronomical regulator, a particularly accurate type of pendulum clock, which was made by John Shelton in 1756, and is now held at the National Museum of Scotland (NMS). Looking at its metadata (below), we can immediately see various ways in which connections might be made from this clock to other objects that share some, or all, of the following characteristics:
- Made by John Shelton, in London, or during 1756
- Part of the History of Science collection
- Incorporates similar materials (wood, brass, glass, etc.)
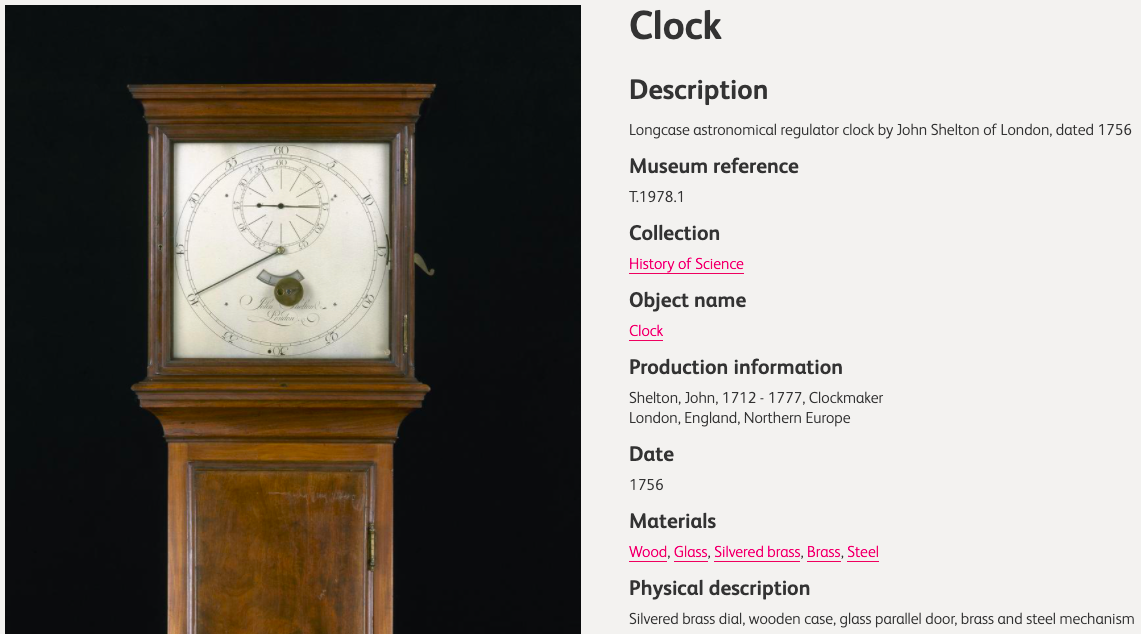
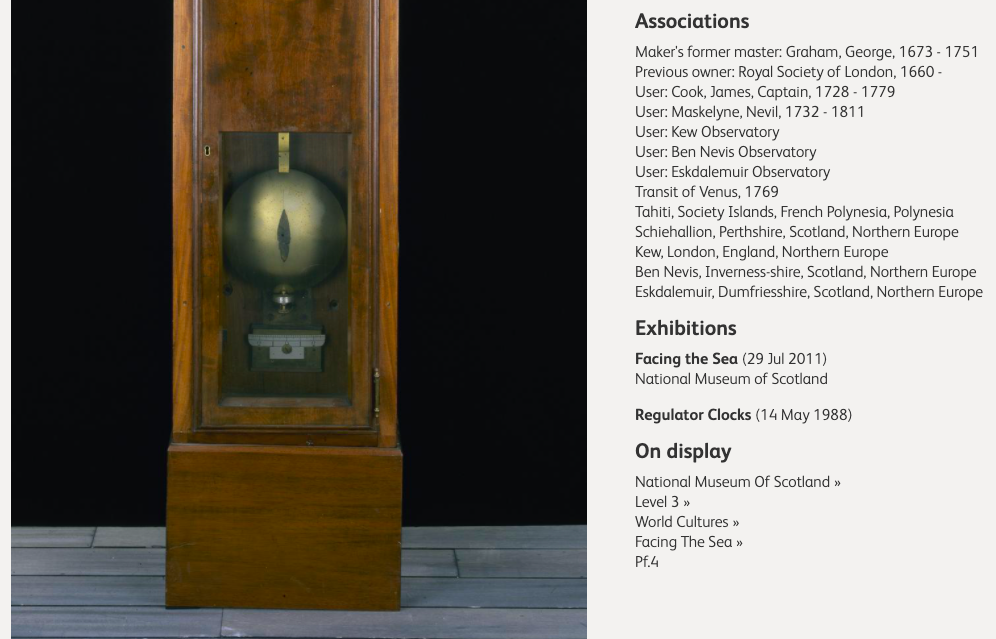
The descriptive sections in the lower part of the catalogue record provide more clues about the adventures this clock has experienced, both before and after its acquisition by NMS.
We might use this information as a starting point for more detailed data modelling to represent different stages of the clock’s itinerary and the places and people involved, as illustrated in the basic timeline below.
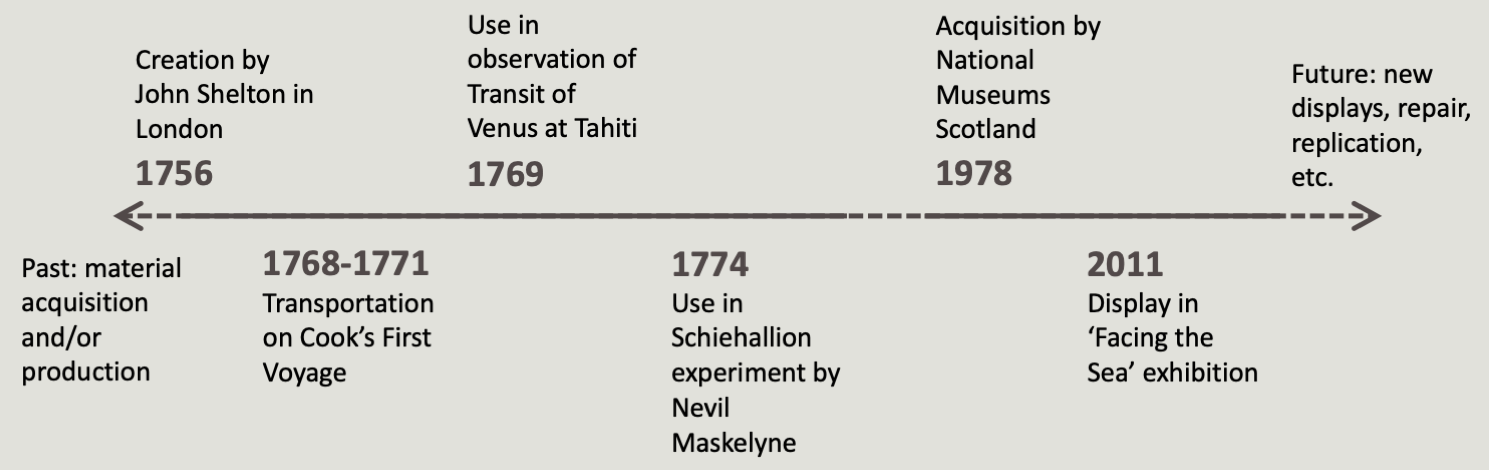
The timeline shows key events in the clock’s history, including its creation and inclusion in an expedition, observation, and experiment. A gap in its itinerary is then indicated by the broken line, before its acquisition by NMS and subsequent display. Substantial research has already been conducted on the itinerary of the Shelton clock that is not currently reflected in the NMS catalogue record, but which might be used to fill this gap as part of a more in-depth case study. On either side of this timeline, we can also anticipate how the clock’s itinerary might be modelled further into the past and future.
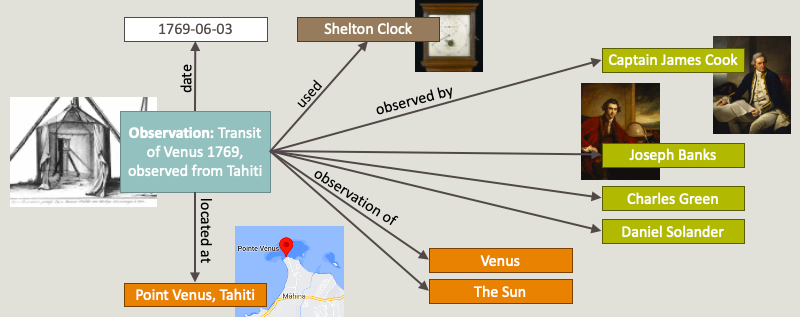
As shown in the above timeline, the Shelton clock was used in observing the 1769 transit of Venus at Tahiti. If we wanted to represent this usage of the object with an event-based data model, we can classify the event as an observation, pinpoint it to an exact date, and state that the Shelton Clock was used. We can also link the observation event to other entities and, implicitly, the information about them. These entities include the people who carried out the observation (e.g., Captain James Cook, Joseph Banks, Charles Green and Daniel Solander), as well as the places involved (e.g., Point Venus and the planet Venus). Each entity has one or more records in other authoritative sources (e.g., Wikidata, GeoNames, VIAF, or the Getty Vocabularies) that contain key information about them; linking to these records will implicitly link to this information, which might include geographical coordinates, or birth and death dates, for example.
We can also look at the observation event as part of a wider expedition event: Cook’s First Voyage started in Plymouth, travelled to Tahiti for the observation (with various stops along the way), then explored New Zealand and Australia before returning home. If a project on Cook’s voyages, for example, chose to use a similar event-based approach, the observation event on our original object’s itinerary might therefore be linked to a wealth of other historical information, to situate it in a broader context.
Case Study 2: Marine Timekeeper K1
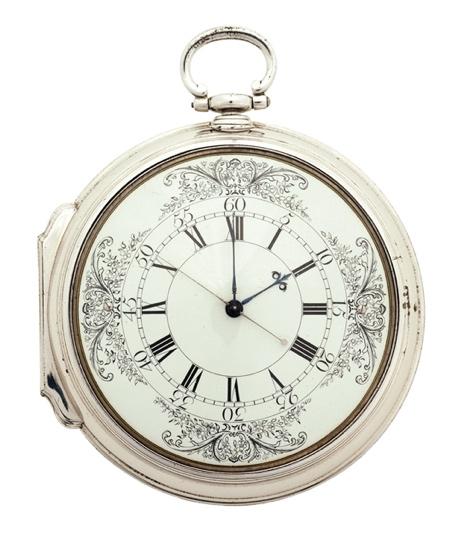
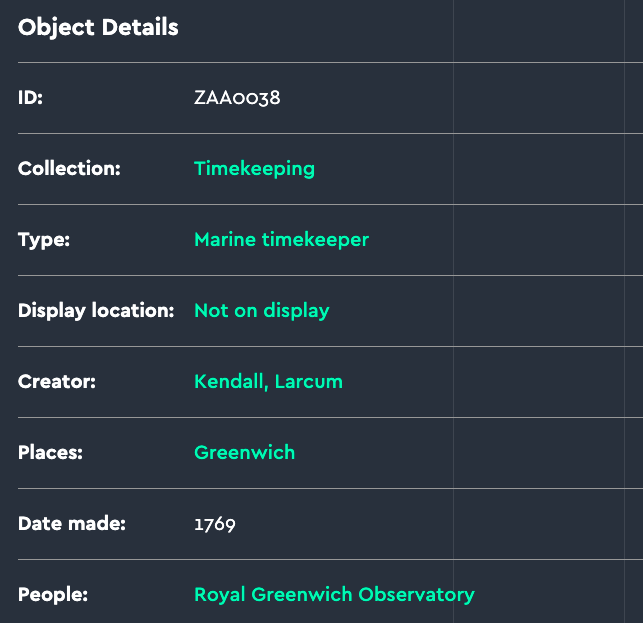
Continuing the theme of Cook’s voyages, the next case study focuses on marine timekeeper K1, which was made by Larcum Kendall and trialled on Cook’s Second Voyage. K1 is held at one of our partner institutions, the National Maritime Museum, with some sections of its catalogue record shown below. Like the Shelton Clock, its main metadata fields have potential for linking directly to other objects, places, and people, accompanied by descriptive information from which we can extract events.
As with the Shelton clock, I have included some of the events from K1’s description on a timeline of its itinerary (below), focusing on its early years. In K1’s case, I started from the moment of its commission, rather than its creation, further demonstrating the need for ‘fuzziness’ when attempting to establish the beginning or end of an object’s itinerary.
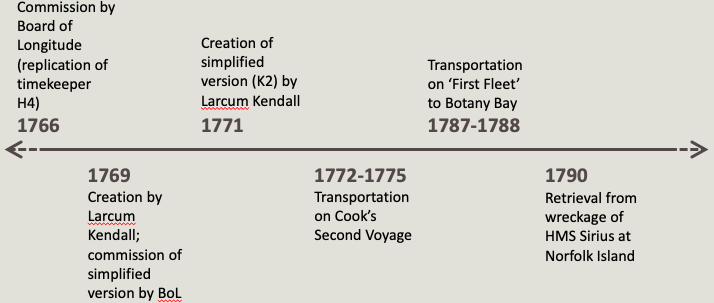
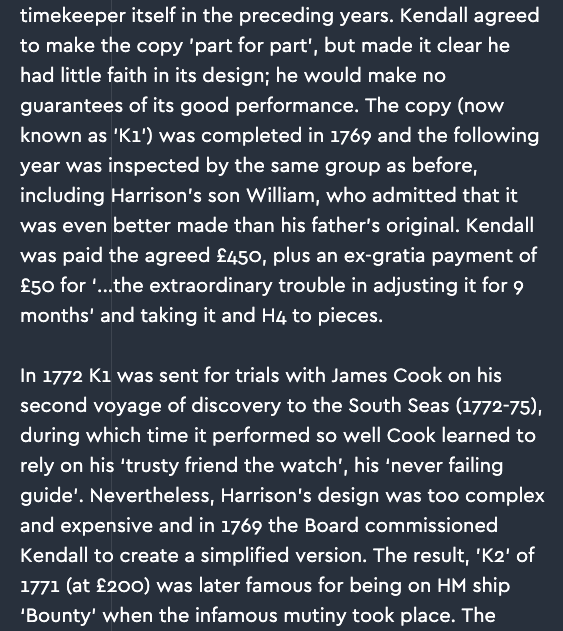
Like the Shelton Clock, K1 is very well-travelled: as well as accompanying Captain Cook, it journeyed to Australia on the ‘First Fleet’ and was later retrieved from a shipwreck at Norfolk Island. While these adventures are intriguing, my focus will now turn to the early events in its known itinerary, to demonstrate how K1’s connections with related objects may be established.
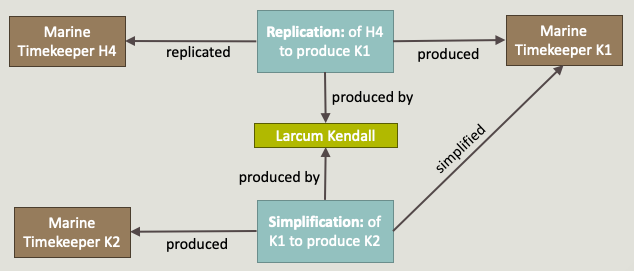
As shown in the above timeline, K1 was not a completely new creation, but instead replicated a previous marine timekeeper, known as H4, which had been produced by John Harrison and achieved considerable success during Board of Longitude trials. Furthermore, having produced K1, Kendall was then asked to simplify its design, and produced K2 as a result. Modelling these replication and simplification events produces explicit connections between the objects themselves through the maker of both K1 and K2, the watchmaker Larcum Kendall.
Object Itineraries: Final Thoughts
Modelling objects in terms of events that occur throughout their journey across space and time increases the scope for connections to people, places and other objects to be described within the data model, as well as allowing greater specificity about the nature of relationships between them. Using the event as the central point of focus allows a richer representation of information and brings a narrative aspect to the data. Applying this approach in Tools of Knowledge, to combine existing datasets about scientific instruments and their makers, will support a rich visual analysis of the data and facilitate the discovery of new insights about the people, places and objects whose data we are modelling. Further blogs will detail some of those explorations.

Leave a comment